Introduction
The averages is defined as the mean value which is equal to the ratio of the sum of the number of a given set of values to the total number of values present in the set.
Simply put,
Average = Sum of Values/ Number of values
Types of Averages
There are number of different averages in the mathematical theories and their uses vary accordingly. Some of them are:

Mathematical Averages
Arithmetic Mean
The Arithmetic mean is the most common type of Average. If n numbers are given, each number denoted by ai(where i = 1,2, …, n), the arithmetic mean is the sum of the as divided by n, then:

where,
- n is the number of observation
- i represent the index of summation
- and ai = data value for the given index
Geometric Mean
The geometric mean is a method to find the central tendency of a set of numbers by finding the nth root of the product of n numbers. It is completely different from the arithmetic mean, where we add the observations and then divide the sum by the number of observations. But in geometric mean, we find the product of all the observations and then find the nth root of the product, provided that n is number of observations.
The formula is given by:
Geometric Mean,
x1, x2, x3,…, xn are the individual items up to n terms
Harmonic Mean
The harmonic mean is defined as the reciprocal of the average of the reciprocals of the given data values.
The formula to find the harmonic mean is given by:
Harmonic Mean, HM = n / [(1/x1)+(1/x2)+(1/x3)+…+(1/xn)]
Where x1, x2, x3,…, xn are the individual items up to n terms.
Positional Averages
Median
The Median is the middle number in a list of sorted numbers.
Mode
The Mode is the most frequently-occurring value in a set of values. The mode is interesting as it can be used for any type of data, not just numbers.
Weighted Averages
A weighted average is most often computed to equalize the frequency of the values in a data set. In any case, in a weighted average, each data point value is multiplied by the assigned weight which is then summed and divided by the number of data points. In a weighted average, the final average number reflects the relative importance of each observation and is thus more descriptive than a simple average.
For example, a survey may gather enough responses from every age group to be considered statistically valid, but the 18-34 age group may have fewer respondents than all others relative to their share of the population. The survey team may weight the results of the 18-34 age group so that their views are represented proportionately.
Moving Averages
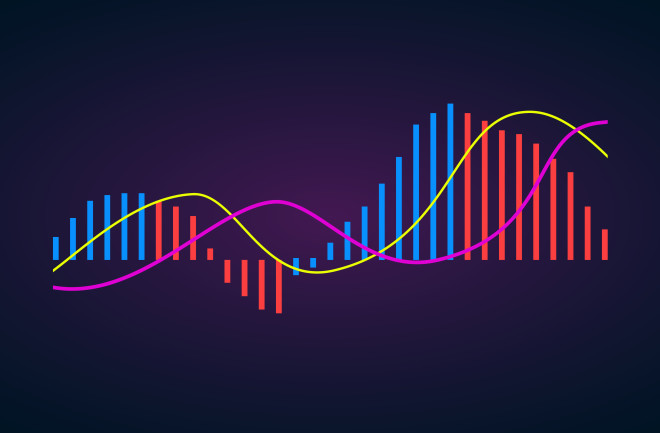
Moving averages are trend indicators and are frequently used due to their simplicity and effectiveness. Moving averages can be calculated for any time frame, from minutes, hours to years. Any time frame can be selected from the charting software-based of your requirements.
Conclusion
Averages is one of the most important statistical analysis used in every sphere of life. Therefore, many mathematicians have given so much emphasis on using averages in many advance researches.


