Financial Ratios are of three types: Financial Ratios in Revenue Statement, Financial Ratios in Balance Sheet, and Combined Ratios. Earlier, we discussed about the Balance Sheet ratios in the previous article. Click on the link to learn more about them.
In this article, let’s learn about revenue ratios and combined ratios (having one element from the balance sheet and another from the income statement).
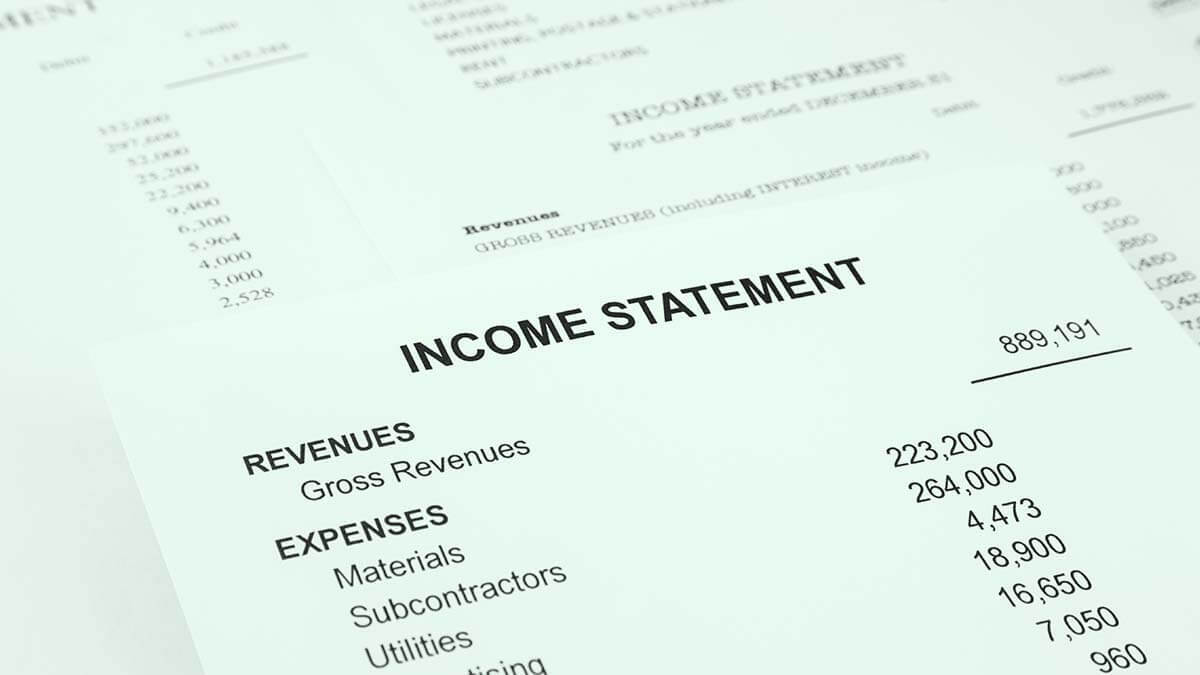
A draft of the format Income/Revenue statement is:
| Gross Sales | XX | |
| (-) Sales Returns | (XX) | |
| Net Sales (A) | XX | |
| (-) Cost of Goods Sold (COGS) (B) | ||
| (+) Trading Dr | XX | |
| (+) Factory Expenses | XX | |
| (-) Trading Cr | (XX) | (XX) |
| Gross Profit/Loss (A-B) (C) | XX | |
| (-) Operating Expenses (D) | ||
| Administrative Expenses | XX | |
| Selling Expenses | XX | |
| Finance Expenses | XX | (XX) |
| (+) Operating Income (E) | XX | |
| Operating Profit/Loss (C-D+E) (F) | XX | |
| (-) Non-operating expenses (G) | (XX) | |
| (+) Non-operating income (H) | XX | |
| NPBT (Net Profit Before Tax) (F-G+H) (I) | XX | |
| (-) Tax provisions | (XX) | |
| NPAT (Net Profit After Tax) | XX | |
| (-) Appropriations | (XX) | |
| Retained Earnings | XX |
Financial Ratios in Revenue Statement
Financial Ratios in Revenue Statement or Revenue Ratios are of two types- Firstly, Profitability Ratios indicate the company’s profitability. Moreover, there is a direct relationship between the ratio and the profitability of a company. The higher the Revenue Ratio, the better the company’s performance and higher profits.
Secondly, Cost Ratios show the expenses or costs of a company. The higher the Cost Ratio, the less the profitability. For example, if the operating cost is 60%, the operating profits are 40% from product A. On the other hand, the operating cost from product B is 55%, and the profits are 45%. Hence, from the above ratios, one can conclude that product B’s performance is better than product A.
Revenue Ratios are percentage and turnover ratios, unlike Balance Sheet Ratios which are in pure form. Moreover, Revenue Ratios are based on net sales of the company to determine profitability.

Types of Financial Ratios in Revenue Statement
There are six types of financial ratios in revenue statement:
- Firstly, Gross Profit Ratio= Gross Profit/Net Sales*100. Here, Gross Profit= Net Sales – COGS.
- Secondly, Net Profit Ratio= NPAT (or NPBT)/Net Sales*100.
- Thirdly, Operating Profit Ratio= Operating Net Profit/Net Sales*100. Here, Operating Net Profit= Gross Profit – Operating Expenses + Operating Income.
- Further, Operating Ratio/Operating Cost Ratio= COGS + Operating Expenses/Net Sales*100. Also, Operating Cost= COGS + Operating Expenses.
- Then, Operating Expense Ratio= Operating Expense/Net Sales*100. However, there are specific expenses like- selling expense ratio, administrative expense ratio, etc. For instance, if one asks to calculate the Selling Expense Ratio, the formula is Selling Expense/Net Sales*100.
- Lastly, Stock Turnover Ratio= COGS/Average Stock. Here, Average Stock= Opening Stock + Closing Stock/2. **Also, if opening stock is not given, assume closing stock as average stock. However, Stock Turnover Ratio is not in percentage form. Moreover, it indicates the number of times the stock circulates from the godown or the number of times the stock gets dispatched. In addition, one also calculates Stock Holding Period= 12 months or 52 weeks or 365 days/ Stock Turnover Ratio. It shows the average number of days or weeks or months one keeps the stock in the godown before dispatch or circulation.

Combined Ratios
Combined Ratios have one element from the balance sheet and another from the revenue statement. They are mainly of nine types:
Debtor Turnover Ratio
Firstly, Debtor Turnover Ratio= Net Credit Sales/Average Debtors + Average Bills Receivable. Here, Net Credit Sales= Credit Sales – Sales Return.
Moreover, Average Debtors= Opening Debtors + Closing Debtors/2
Average Bills Receivables= Opening Bills Receivable + Closing Bills Receivable /2.
To calculate average debtors and bills receivables, one needs two-year balance sheet data. If only a one-year balance sheet is given, the formula becomes Net Credit Sales/ Debtors + Bills Receivable (directly the amount).Moreover, it indicates the number of times debtors and bills receivables cover up the credit sales of a company.
Moreover, one also calculates the Debtors’ Collection Period= 12 months or 52 weeks or 365 days/ Debtor Turnover Ratio. It indicates the average time taken by the debtors or customers to make payments to the company.
Creditor Turnover Ratio
Secondly, Creditor Turnover Ratio= Net Credit Purchases/Average Creditors + Average Bills Payable. Here, Net Credit Purchases= Credit Purchases – Purchase Return.
Moreover, Average Creditors= Opening Creditors + Closing Creditors/2
Average Bills Payable= Opening Bills Payable+ Closing Bills Payable/2.
If only a one-year balance sheet is given, the formula becomes Net Credit Purchases/ Creditors + Bills Payable (directly the amount).Additionally, it indicates the number of times creditors and bills payable cover up the credit purchases of a company.
Moreover, one also calculates the Creditors Collection Period= 12 months or 52 weeks or 365 days/ Creditor Turnover Ratio. It indicates the average time taken by the company to pay the suppliers. Also, the higher the turnover ratio, the lesser is the collection period, and vice-versa.
Earnings Per Share
Thirdly, Earnings Per Share (EPS)= NPAT – Preference Dividend/No. of Equity Shareholders. Moreover, it depicts the amount each shareholder earns from the company’s total earnings. For instance, the NPAT is 1.5 lakhs, and the preference dividend is ₹50,000. Therefore, the earnings are one lakh. However, the entire one lakh is not declared as a dividend. The company might retain ₹60,000 of the earnings as reserves and distribute ₹40,000 as a dividend to equity shareholders. If there are 10,000 equity shareholders, the EPS= 1,00,000/10,000, which is ₹10.
Dividend Per Share
Further, Dividend Per Share= Amount of Equity Dividend/No. of Equity Shareholders. For example, taking the above scenario, Dividend Per Share= 40,000/10,000, which is ₹4.
Dividend Payout Ratio
Then, Dividend Payout Ratio= Dividend Per Share/Earnings Per Share*100. For instance, taking the above scenario, Dividend Payout Ratio= 40,000/1,00,000*100 which is 40%. moreover, it indicates the percentage of earnings kept for equity shareholders as dividends.
Retention Ratio
Further, Retention Ratio= 1 – Dividend Payout Ratio. For example, taking the above scenario, Retention Ratio= 1 – 40% which is 60%. Moreover, it indicates the percentage of earnings held as reserves.
Return on Capital Employed
Then, Return on Capital Employed (ROCE)= NPBT + Interest/ Capital Employed*100. Here, Capital Employed= Owners Funds + Loan Funds. Moreover, the interest is the amount of interest charged on loan funds. ROCE indicates how much profit a company earn from every ₹1 of capital employed, before the payment of tax and interest. Additionally, the higher the ROCE, more is the profitability.
Return on Shareholders/Equity/Net worth Funds
Further, Return on Shareholders Funds= NPAT/Shareholders or Owners Funds*100. Here, we exclude loan funds, and hence interest is also not being considered.
Return on Equity Capital
Lastly, Return on Equity Capital= NPAT- Preference Dividend/Paid-up Equity Share Capital*100. Here, we exclude all other factors and concentrate on equity. Moreover, it indicates the company’s profitability from the funds raised from equity shareholders.