A ratio is a relation between two variables. Further, they are of three types- Pure, Percentage, and Turnover ratios. Before jumping into balance sheet ratio analysis, let’s understand the meaning of financial ratios.
Financial ratios help compare financial variables to analyze the company’s financial performance and position. Further, they are of three types- Balance Sheet, Income Statement, and Combined Ratios.
- Firstly, Balance Sheet Ratios have both variables from the balance sheet.
- Secondly, Income Statement Ratios have both variables from trading and P&L accounts (income statement).
- Lastly, Combined Ratios have one variable from the balance sheet and another from the income statement.
Moreover, six ratios help in Balance Sheet Ratio analysis.
Current/Working Capital/Short Term Solvency Ratio
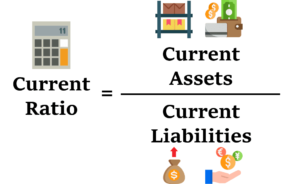
The Current Ratio evaluates financial solvency in the short run, up to one year. Hence, it depicts whether a company is in a position to pay off its liability within a year.
Current Ratio= Current Assets/Current Liabilities
Further, the standard/benchmark current ratio is 2:1. However, a slightly higher or equal ratio is acceptable (in the range of 2:1 to 3:1).
For example, the current ratio of a company is 1.5:1. It is not acceptable as the current assets are insufficient to pay off the current liabilities in the short term. hence, it shows that the company is in a short term insolvency position.
And if the company has a current ratio of 3.5:1, it is still not beneficial because more funds are locked in current assets. Hence, the company cannot use the funds for productive purposes. Hence, it shows a deficiency of funds in the short run.
Liquid/Quick/Acid Test/Immediate Solvency Ratio
Current Assets are of two types:
- Quick Assets are assets with more liquidity, easily converted to cash or cash equivalent. For example- cash, debtors, banks, etc.
- On the other hand, Non-Quick Assets are assets with less liquidity, not easily converted to cash or cash equivalent. Stock and Prepayments are non-quick assets.
Current Liabilities are of two types:
- Quick Liabilities are liabilities which are payable immediately. For example, creditors.
- On the other hand, Non-Quick Liabilities are liabilities which are not payable immediately. Advances received and Bank overdrafts are non-quick liabilities.
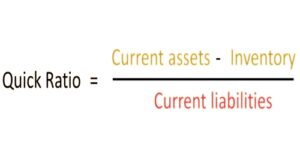
Liquid/Solvency Ratio= Quick Assets/Quick Liabilities OR
=Current Assets – Stock – Prepayment/Current Liabilities – Advance Received – Bank Overdraft
Further, the standard/benchmark current ratio is 1:1. However, a slightly higher or lower ratio is acceptable (in the range of 0.5:1 to 2:1).
A very high liquid ratio (for example- 3:1) means there is a shortage of funds because most of the funds are stuck up in liquid assets. Moreover, a low liquid ratio (for example- 0.2:1) means the liquid assets are insufficient to pay off the liquid liabilities.
Proprietary/Long Term Solvency Ratio
The Proprietary Ratio shows the financial solvency in the long term of the company. Hence, it depicts whether the long-term assets are sufficient enough to pay off the long-term liabilities.
Proprietary Ratio= Owners Funds/Total Assets
Owners Funds= Share Capital + Reserves – Miscellaneous Expenses
Total Assets= Investments + Fixed Assets + Current Assets
Further, the standard ratio is 0.6 to 0.75:1.
For example, the total assets are worth ₹1,00,000 out of which ₹30,000 is for shareholders and the remaining ₹70,000 is for external creditors. Hence, the proprietary ratio of a firm is 0.3:1. It also means the firm is in a long-term insolvency position. Therefore, it does not have enough long-term assets to meet long-term liabilities. The shareholder’s funds of ͅ₹30,000 (0.3) out of ₹1,00,000 (1) assets indicate less net worth. If the company dissolves in the long run, the shareholders will get fewer funds which could have a negative impact on the shareholders, they might exit or sell off their holdings.
Moreover, if the total assets are ₹1,00,000 and the shareholders’ liability is ₹1,50,000, the proprietary ratio is 1.5:1. Out of ₹1,00,000, first, the firm will pay off all the creditors and then the shareholders. But the shareholders’ liability is more than the total assets. Hence, in this case, the company will have insufficient assets to pay off the shareholders in the long run.

Stock to Working Capital Ratio
As the name indicates, the amount of money financed to bring in inventories.
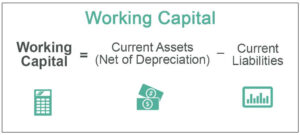
Stock to Working Capital Ratio= Closing Stock/Working Capital
Working Capital= Current Assets-Current Liabilities
Further, the standard ratio is 1:1.
Moreover, a very high stock to working capital ratio indicates that the company is holding a lot of stock or cannot sell the stock, due to less demand for products. Also, having a lot of stock leads to the blocking of funds.
If there is a low stock to working capital ratio it depicts that there is a shortage of stock, compared to the working capital requirements.
Debt-Equity Ratio
Debt-Equity Ratio= Debt/Equity OR Borrowed Funds/Owners Capital
Borrowed Funds= Loan Funds
Owners Funds= Share Capital + Reserves – Miscellaneous Expenses
Further, the standard/benchmark current ratio is 2:1. However, a slightly higher or lower ratio is acceptable (in the range of 1.5:1 to 3:1).
If the debt is higher than the equity, the company will use profits to pay off third party liabilities and shareholders will have less share in profits.
If the equity is higher than the debt, the company will face more interference from shareholders in the management.
Capital Gearing Ratio
A Capital Gearing Ratio is a ratio between funds with fixed rates and no fixed rates. For instance, in the case of loans and preference shares, there is a fixed rate of dividend. Moreover, regarding reserves and equity (dividend), the rate of dividend depends on profits, hence fluctuating.
Capital Gearing Ratio= Borrowed Funds + Preference Share Capital/Owners Funds – Preference Share Capital

Further, the benchmark ratio is 1:1.
Low Capital Gearing Ratio- When the ratio is less than 1:1.
High Capital Gearing Ratio- When the ratio is more than 1:1.
Balance Sheet Ratio Analysis Example
As mentioned before, for the Balance Sheet Ratio Analysis, there are six ratios. Hence, compute the six balance sheet ratios from the balance sheet given below:
| Liabilities | Amount | Assets | Amount |
| Share Capital | 10,000 | Computers | 7,000 |
| Profit & Loss A/c | 1,500 | Plant and Machinery | 25,500 |
| General Reserve | 2,000 | Stock in Trade | 10,000 |
| 12% Debentures | 29,000 | Sundry Debtors | 5,000 |
| Sundry Creditors | 5,000 | Bills Receivables | 500 |
| Bank Overdraft | 2,500 | Cash at Bank | 2,000 |
| 50,000 | 50,000 |
- Current Ratio= Current Assets/Current Liabilities
= 10,000+5,000+500+2,000/5,000+2,500
= 2.33:1
Hence, the company is in a short-term solvency position as the current ratio is marginally higher than the standard ratio of 2:1.
- Quick Ratio= Current Assets – Stock – Prepayment/Current Liabilities – Advance Received – Bank Overdraft
= 17,500-10,000-0/7,500-0-2,500
= 1.5:1
Therefore, the company is in an immediate short term solvency position as the ratio is marginally higher than the standard ratio of 1:1 but within the acceptable range.
- Proprietary Ratio= Owners Funds /Total Assets
= 10,000+1,500+2,000/50,000
= 0.27:1
Hence, the company is in a long-term insolvency position because the proprietary ratio is less than the standard of 0.6 to 0.75:1. Therefore, in future, a major chunk of assets will go towards liabilities resulting in fewer returns for shareholders.
- Stock to Working Capital Ratio= Closing Stock/Working Capital
= 10,000/17,500-7,500
= 1:1
Hence, the company has sufficient stock to meet its working capital requirements because the stock to working capital ratio is in line with the standard ratio.
- Debt-Equity Ratio= Borrowed Funds/Owners Capital
= 29,000/13,500
= 2.15:1
Hence, the company’s capital structure is desirable because the debt-to-equity ratio is marginally higher than the standard ratio of 2:1.
- Capital Gearing Ratio= Borrowed Funds + Preference Share Capital/Owners Funds – Preference Share Capital
= 29,000+0/13,500-0
= 2.15:1
Therefore, the company has a high capital gearing ratio.