Introduction
Cohort analysis is an analytical technique that categorizes and divides data into groups with common characteristics prior to analysis. A cohort is a group of people who share a common characteristic over a certain period of time, such as users that have become customers at approximately the same time, a graduating class of students, or contact tracing individuals during a pandemic.
Using cohort analysis, marketing campaigns allow firms to compare their customers based on different factors. The factors could be spending patterns of customers, product reviews, preferences, etc. The comparison helps in making strategic marketing decisions.
Cohort analysis is a tool to measure user engagement over time. It helps to know whether user engagement is actually getting better over time or is only appearing to improve because of growth.
Cohort analysis proves to be valuable because it helps to separate growth metrics from engagement metrics as growth can easily mask engagement problems. In reality, the lack of activity of the old users is being hidden by the impressive growth numbers of new users, which results in concealing the lack of engagement from a small number of people.
How to break the group of users into cohorts for cohort analysis – can be done in two ways:
- Acquisition Cohorts: divide users by when they signed up first for your product. For your app users, you might break down your cohorts by the day, the week or the month they launched an app, and thereby track daily, weekly or monthly cohorts.
- Behavioral Cohorts: divide users by the behaviors they have (or haven’t) taken in your app within a given time period. These could be any number of discrete actions that a user can perform – App Install, App Launch, App Uninstall, Transaction or Charged, or any combination of these actions / events.
Benefits of Cohort Analysis
As a business analytics technique, a Cohort Analysis allows you to compare variables and changes between your digital marketing campaigns.
For example, like real brick-and-mortar stores, websites change. If you’re doing it right, they change a lot and often. You can use a cohort analysis to try to isolate the effect of the website modification on user behavior.
Here are some factors that can impact user behavior that you may want to analyze with a Cohort Analysis:
- Target audience
- Ad content
- Channels
- Campaigns/experiments
- Website redesigns
- New product lines and service offerings
- Sales, discounts, promotion campaigns
Limitations
- Biases – Most analysts possess some form of biases or prejudice. The study may lose objectivity if it falls prey to the prejudices of the analysts. Biases could be selection bias, decision bias, personal bias, etc.
- Only such data that are statistical in nature can be used for this kind of analysis.
- The traits have to be defined by a defined period of time.
Process
Step 1: Pull the raw data
Typically, the data required to conduct cohort analysis lives inside a database of some kind and needs to be exported into spreadsheet software. In this example, we use MySQL and Microsoft Excel.
Step 2: Create cohort identifiers
Open the data you’ve pulled into Excel. Since we pulled the “cohort date” attribute in the example above, we’ll conduct the popular cohort analysis in which we compare groups of customers based on when they made their first purchase. Assuming we want to group our cohorts based on the month in which they made their first purchase, we’ll need to translate each “cohort date” value into a “bucket” that represents the year and month of their first purchase.
Step 3: Calculate Lifecycle stages
Once we know the cohort that each customer belongs to, we also need to determine the “lifecycle stage” at which each event happened for that cohort member.
Step 4: Create a pivot table and graph
Pivot tables allow you to calculate an aggregation such as a sum or average across multiple dimensions of your data. The pivot table we’d like to create is one that conducts a sum of transaction amount, and shows one row per cohort and one column per relative time period.
Types of Cohorts to Analyze
Cohorts can be grouped into the following categories:
1. Time-Based Cohorts
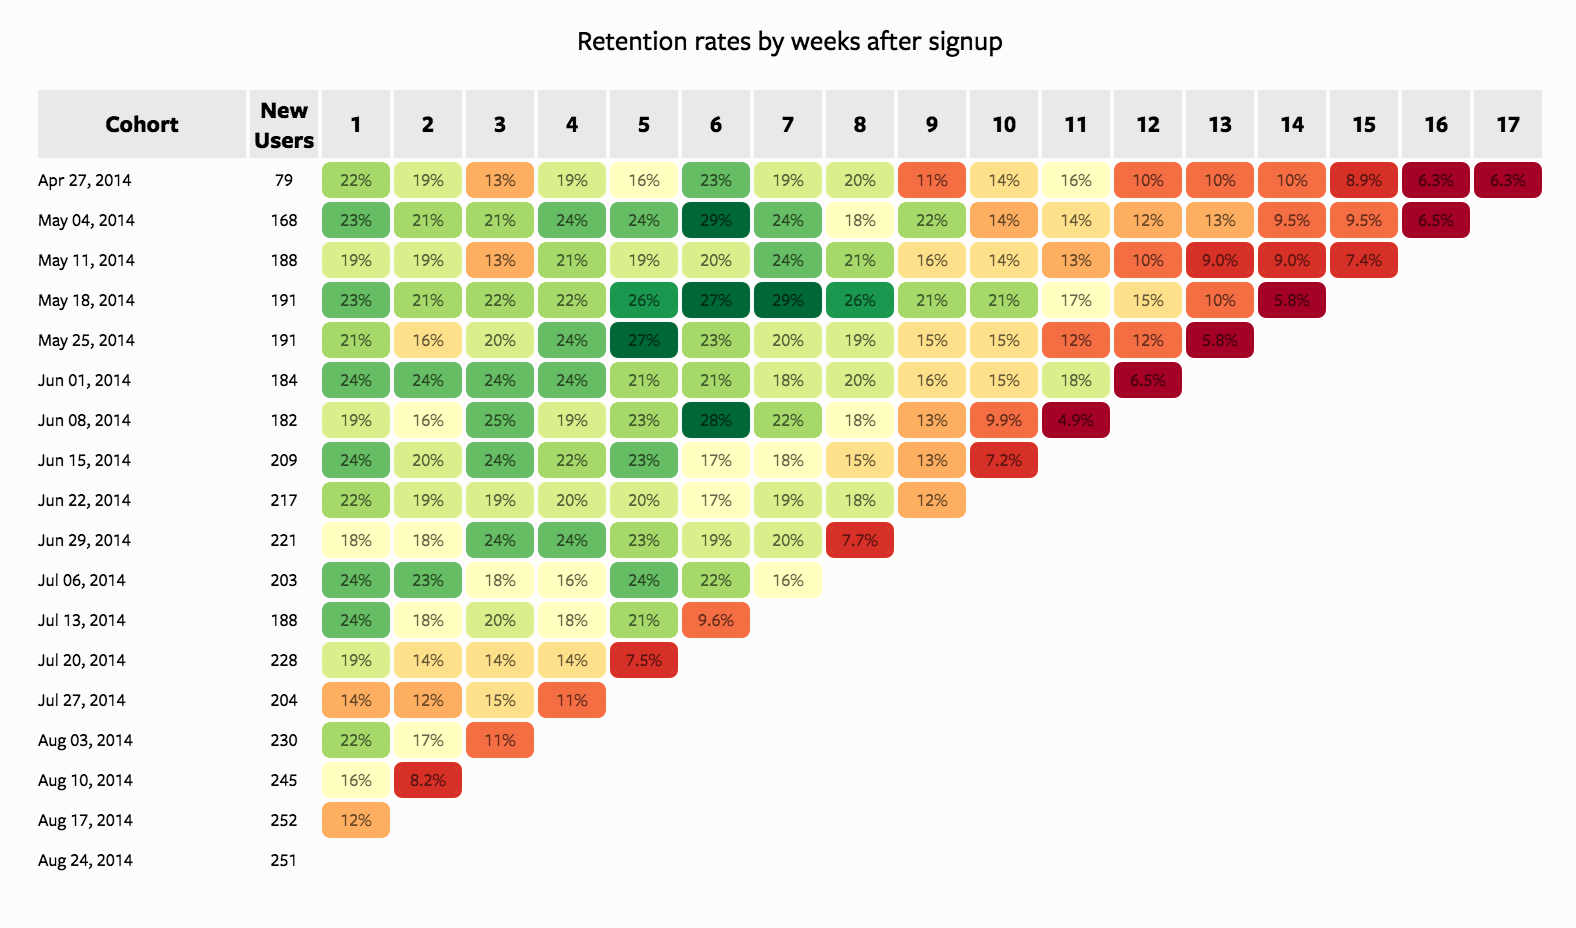
Time-based cohorts are customers who signed up for a product or service during a particular time frame. Analyzing these cohorts shows the customers’ behavior depending on the time they started using a company’s products or services. The time may be monthly or quarterly, depending on the sales cycle of a company. Analyzing the time-based cohorts helps in looking at the churn rate.
For a SaaS business, the churn rate tends to be high at the start of a given timeframe, and drops as the customers get used to the products. Customers who stay longer with the company tend to love the product and churn at a lower rate than at the start of a time frame. In the absence of cohorts, a company may not identify the exact cause of a high number of customers abandoning the products within a given timeframe.
2. Segment-Based Cohorts
Segment-based cohorts are those customers who purchased a specific product or paid for a specific service in the past. It groups customers by the type of product or level of service they signed up for. Customers who signed up for basic level services might have different needs than those who signed up for advanced services. Understanding the needs of the various cohorts can help a company design tailor-made services or products for particular segments.
3. Size-Based Cohorts
Size-based cohorts refer to the various sizes of customers who purchase a company’s products or services. The customers may be small and startup businesses, middle-sized businesses, and enterprise-level businesses.
Comparing the different categories of customers based on their size reveals where the largest purchases come from. For categories with the least purchases, the company can review any issues with the product and service offering and brainstorm areas for improvement that can boost the level of sales.
Conclusion
The power of cohort analysis lies in the fact that, it enables not only to view which customers leave and when they leave, but also to understand why the customers leave your app – so that you can fix it. That’s how one can identify how well the users are being retained and also determine the primary factors driving the growth, engagement and revenue for the app.